Showing posts with label Melinda Deleuze. Show all posts

Friday, 11 July 2014

Counting Pennies: A new PISA report compares students’ financial know-how

This blog is written by Wikichild co-ordinator Melinda Deleuze. The post presents findings from the latest PISA report, highlighting the links between students' financial literacy levels and their socio-economic background. It is a part of the Wikiprogress spotlight on Education and Skills.

The importance of financial literacy among young people is growing, as more adolescents have access to financial services, have their own bank accounts, make independent financial decisions, and are often in paid employment as well as school. More than ever, the ability of students to manage their finances is central to their immediate and future well-being. Furthermore, rising tuition costs, and the increasing burden of student debt, is a major issue in countries around the world. Earlier this year in Chile, an activist burnt student debt papers worth $500 million in protest of widespread student poverty. Financial literacy is therefore of key importance, not just at the individual level, in terms of enabling young people to avoid or minimise debt or to plan for a more financially-secure future, but also at the societal level.

Queen Maxima of the Netherlands
at the PISA launch
On Wednesday, the OECD launched Volume VI of the PISA 2012 results entitled “Students and Money: Financial Literacy Skills for the 21st Century.” This part of the PISA survey, the first ever cross-national evaluation of financial literacy among young people, involved 29,000 students from 18 countries. The 15 year-olds are asked questions with 5 different levels of questions, from recognising the purpose of an invoice (Level 1) to identifying which loan is the best offer.
(You can take the test here!)
Average scores in all participating countries


Across the 18 countries, students show a wide range of financial skills and knowledge. Shanghai-China students had the strongest performance with a mean score of 603 points, while Colombian students averaged the lowest mean score of 379 points. A majority of the countries are in a tighter point span, ranging from 520 to 480, such as the United States (492 points) and France (486 points). 
Distribution of differences in scores


However, even within countries students demonstrate varying levels of financial literacy. In New Zealand, the top 5% of students score around 700 score points, while the bottom 5% score around 300 points. This 400-point difference equates to about 10 years of schooling.


In addition to providing results on students’ financial literacy levels, the report also explores the relationships between financial literacy and other factors (including gender, rural vs. urban, immigration, mathematics performance, attitudes and socio-economic background). The relationship between socio-economic status and financial literacy comes across as especially important to acknowledge, as it shows a system’s ability to break vicious cycles of inequality and promote truly inclusive growth. In a successful system, students would obtain higher levels of financial literacy regardless of the parents’ level of education, income or wealth. Also, a system which does not rely on parents to transmit financial literacy has greater chances of reducing inequalities in household wealth in the long-term.


Across the 13 participating OECD countries, financial literacy performance increases by 41 score points with every one-unit increase in the PISA index of socio-economic status (ESCS). This score gap represents the equivalent to about one extra year of schooling for students who have above-average family wealth and additional educational resources at home The difference between the students in the top quarter and bottom quarter of socio-economic index amounts to 91 score points (over two years of schooling). A students’ socio-economic status, therefore, explains a large proportion of the variation in financial literacy in OECD countries, more so than gender or immigrant background. 

% variation explained by socio-economic status
Estonia appears to be the champion of breaking socio-economic boundaries in this field, with only a 53-point difference between the students in the top quarter and the bottom quarter of socio-economic status. It is the only country whose students overall have an above-average financial literacy performance, and that has a weak association between financial literacy performance and socio-economic status. It achieves high performance without leaving behind the disadvantaged students.  

Parents’ life decisions also impact students’ financial know-how. Both parents’ occupation and their level of education are strongly related to students’ financial literacy performance in the OECD countries. The financial literacy performance of students with at least one parent with tertiary education differs by an average of 40 score points in comparison to those whose parents do not have a higher education degree. Again, that corresponds to one year of schooling. There is a large range among the countries’ average differences, from Israel’s 79-point difference to Italy’s 9-point difference.

In all countries, the students with at least one parent in a skilled occupation, such as a manager or professional, have a higher financial literacy score than students whose parents work in semi-skilled or low-skilled occupations. The average difference in financial literacy performance between these student groups is 54 points. However, the variation among countries for parents’ occupation is not as stark as it is for parents’ education. Israel has a 75-point difference, while both Italy and the Russian Federation show the smallest differences with 34 points each. Overall, these results show that home-related factors do impact a student’s performance and financially literate parents could make a difference of a year of schooling.

Fortunately, governments are already taking this important issue to heart, with over 50 countries implementing a national strategy for financial education, compared to 10 countries in 2008. The next assessment of students’ financial literacy will to be taken in 2015, allowing for the first comparison of change over time. Fingers-crossed for more good examples like Estonia by then!


*The graphs used in this post were presented at the report's launch on 9 July, 2014.


Tuesday, 6 May 2014

Do family characteristics affect children's health?

This blog, written by Wikichild co-ordinator Melinda Deleuze, provides an overview of the latest World Family Map 2014. The report takes a look at family characteristics across the globe to see if they affect children's health. The post is a part of Wikiprogress' Series on Health.

The World Family Map Project measures and monitors global changes in the family. Last month, the World Family Map 2014 was released and it sure has a lot going on! This second annual edition provides 1) updates on the project’s 16 indicators, 2) an essay on union stability and child health in developing countries, as well as 3) a short analysis of psychological distress among 9 to 16 year olds in the European Union (EU). This blog will provide an overview of the report’s three sections, sharing a few of the findings. 

The Countries included in the World Family Map 2014

The Data Updates, part 1

The first section, representing a bulk of the report, offers an inside view of families within 49 countries. The report presents a description of the data trends, showing regional and country differences, as well as colourful tables and maps for almost every indicator. The report pulls data from a multitude of sources: country-level sources; DHS; FAO; Integrated Public Use Microdata Series-International (IPMUS); LIS; OECD; PISA; UNICEF Innocenti Research Center; World Value Surveys. The blending of these surveys produces 16 indicators divided into 4 domains: family structure; family socioeconomics; family processes; family culture.

The “family structure” dimension includes data regarding living arrangements, marriage and cohabitation rates, fertility rates, and non-marital childbearing rates. Living arrangements is separated into 2-parent households, single-parent households, neither-parent households, and households with extended family members.

The “family socioeconomics” dimension includes poverty, undernourishment, parental education level, parental employment rates, and public family benefits. Poverty measures include both absolute and relative child poverty rates.

The “family processes” dimension includes adult satisfaction with family life, disagreement over household work, teen’s discussion with parents, and family meals around the table with 15 year-olds. Teen’s discussion with parents includes communication frequency measures as well as whether the conversation is about how well the 15 year old is doing in school or about non-school related topics.

Finally, the “family culture” dimension includes measures regarding attitudes toward voluntary single motherhood, attitudes about whether children need both a mother and father, amount of support for working mothers, and family trust.

The Essay, part 2

The report also contains an essay which explores the relationship between family instability and children’s health in developing countries. There are 27 countries observed in Central/South America and the Caribbean, Africa, Asia and the Middle East, using data from the Demographic Health Surveys (DHS). Family instability is measured here by divorce or dissolution of a cohabiting partnership, widowhood, or re-partnership (i.e. re-marriage; cohabitation) during the child’s lifetime. The essay looks into 3 child health measures with varying degrees of severity: diarrhea (acute illness); stunting (longer-term); child mortality (most severe outcome). 


Children of Mothers Who Divorced, Dissolved a Cohabiting Union, and/or Re-partnered More Likely to Have Died in Three Out of Four Regions


The essay suggest that family instability compromises parents’ ability to provide the kind of consistent and attentive care that is most likely to foster good health in children. The essay hypothesizes that union instability may affect children’s health due to additional time and attention consumption, more stress, a disruption of social support networks, and reduction of socioeconomic resources available to parents. The results show that in a number of low-income regions divorce or partnership dissolution and re-partnering are associated with increased negative conditions for all three child health measures. The overall findings suggest that union instability is associated with worse child health outcomes; however, the findings are stronger for diarrhea and death than for stunted growth.

The Analysis, part 3

The third and final section of the report contains an analysis of the 2010 EU Kids Online Survey to determine whether there are links between family structure across Europe and children’s psychological health and if there are variations among countries. The survey contains findings for 1,000 children who use the internet aged 9-16 in each of the 25 EU countries observed. Psychological health is defined as emotional symptoms, conduct problems, hyperactivity/inattention, peer relationship problems, and pro-social behaviour (or voluntary behaviour intended to benefit another).

Odds of Elevated Psychological Difficulties in Sole-Parent Families Relative to Two-Parent Families


The results suggest that in the EU as a whole, children’s living arrangements are related to their psychological well-being. Children from more educated households report fewer psychological difficulties, but household socioeconomic status has the opposite effect, with higher status being associated with more difficulties. 
Overall, the World Family Map 2014 brings a good deal of interesting analysis and provides more insight to important questions facing countries all over the world. I am looking forward to see what new understandings next year’s edition brings.

-Melinda Deleuze

See Also:
The OECD Family Database
Child Family and Peer Relationships


Friday, 4 April 2014

The Well-being of Youth around the Globe

The blog, by Wikichild co-ordinator Melinda Deleuze, is about the new Global Youth Wellbeing Index which measures how youth are doing under 6 domains in 30 countries with hopes of ultimately improving the outcomes for young people around the world. This post is a part of the Wikiprogress Series on Child Well-being.
This week, the International Youth Foundation (IYF) and the Center for Strategic and International Studies (CSIS) launched their "Global Youth Wellbeing Index", with support from Hilton Worldwide. This Index was designed to promote attention to youth issues, to encourage dialogue about the issues, and to invest in young people, given that they are the catalysts for development, prosperity and security. The Index is intended for youth themselves, policymakers, donors and investors, and implementers.

The report on the 2014 results explains some of the situational landscapes in which youth today are living, both negative (i.a. unemployment; poverty; gender inequality) and positive (i.a. education returns; HIV declines; technological know-how). In order to create a clearer picture of what is happening with nearly 70% of the youth (aged 10-24) around the world, the Index uses 40 indicators and provides results for 30 countries.

These indicators are divided into 6 domains (citizen participation; economic opportunity; education; health; information and communications technology; safety and security), with 5-9 indicators per domain. Also, to provide a piece of subjective well-being among youth, the Index integrates 1-2 subjective youth outlook and satisfaction indicators (e.g. perceived stress levels among youth) into each domain.


The main findings highlighted in the report are:
  • A large majority of the world’s youth are experiencing lower levels of well-being (15% experience high or upper-middle well-being, 85% experience lower-middle or low well-being.)
  • Even where young people are doing relatively well, they still face specific challenges and limitations
  • Even where youth may not be thriving, they display success in certain areas
  • How young people feel about their own wellbeing does not always align with what the objective data suggests
  • Across countries, domain average scores indicate youth faring strongest in health and weakest in economic opportunity 
  • Overall, youth well-being trends correlate more strongly with countries’ income levels than with their regions. Young people in wealthier countries tend to have higher overall well-being (see below).  
Global Youth Wellbeing Index Rankings by World Bank Income Classification

The report provides recommendations and next steps:
  • Advance youth voices and participation 
  • Promote deeper-dive and targeted research and analysis 
  • Consider integrated policies and programs
  • Advance the body of age-disaggregated and youth survey data
There are limitations to the Index, such as incomplete, inconsistent and uncoordinated data. The picture of youth also too broad, as the data is not disaggregated by gender, region, rural/urban, disability, religion, socio-economic status, etc.. However, the authors believe that by identifying the relevant data gaps, the Index can also assist the post-2015 development agenda.

The first steps can be difficult, but luckily those involved are aware of the challenges ahead and are willing to take this Index deeper and farther in the coming years. I look forward to seeing what the Global Youth Wellbeing Index will teach us in the coming years.  

Wikichild Co-ordinator 


See Also
The Good Childhood Index
The Child and Youth Well-being Index
UNICEF Child-Wellbeing measure
Child Development Index
Early Development Index
Holistic Early Childhood Development Index

Friday, 11 October 2013

The Road to Ending Child Labour

This blog, written by Wikichild co-ordinator Melinda Deleuze, is part of the Wikiprogress series on Child Labour. It highlights the major reports and steps towards the road to Brasilia, where the 3rd ILO Global Conference on Child Labour was held this week.

Yesterday wrapped up the International Labour Organisation's 3rd Global Conference on Child Labour. The event took place in Brasilia from 8-10 October, 2013 and provided an opportunity to discuss the progress made in the process towards eliminating child labour, especially its worst forms.
We are waiting to hear what the game plan of all the governments, social partners, civil societies, regional and international organisations  for accelerating the elimination of child labour by 2016. In the meantime, let's take a step back and recognise the pathway which led us up to Brasilia.
In 1973, the ILO passed the Minimum Age Convention (no. 138), requiring that people are at least 15, or a higher age determined by member states, or 14 for member states whose education systems are developing, before working, and 18 years old before dangerous work.
In 1998, the 86th International Labour Conference adopted the Declaration on Fundamental Principles and Rights at Work. This declaration contains four fundamental policies:
  1. The right of workers to associate freely and bargain collectively;
  2. The end of forced and compulsory labour;
  3. The end of child labour; and
  4. The end of unfair discrimination among workers.

In 1999, the ILO passed the Worst Forms of Child Labour Convention (no. 182), placing the duty upon member states to identify and take steps to prohibit the worst forms of child labour (slavery, prostitution, drug trafficking and other dangerous jobs).

World Day against Child Labour
The day, which is observed on June 12th, was first launched in 2002 as a way to highlight the plight of these children. It is intended to serve as a catalyst for the growing worldwide movement against child labour, reflected in the huge number of ratifications of ILO Convention No. 182 on the worst forms of child labour and ILO Convention No. 138 on the minimum age for employment.
The World Day Against Child Labour provides and opportunity to gain further support of individual governments and that of the ILO social partners, civil society and others, including schools, youth and women's groups as well as the media, in the campaign against child labour.
Global Report "A future without child labour" (2002)
 
This Report shows how the abolition of child labour has become a global cause for the new millennium. It explores the ever-changing manifestations of child labour throughout the world, and how girls and boys are affected differently, it presents new data on the scale of this stubborn problem, and it sheds new light on its complex, interlinked causes. It charts the growth of a global movement against child labour, reviewing the various types of action being taken by the ILO, its tripartite constituents (governments, employers’ and workers’ organizations) and other actors at international, national and local levels. The Report concludes with proposals for a three-pillar approach to strengthen the action of the ILO in this field, building upon the wealth of experience gained by the International Programme on the Elimination of Child Labour (IPEC) in the decade since its establishment.
 

Second Global Report "The end of child labour: Within reach" (2006)

This ILO Global Report on child labour highlights the progress made in combating child labour, steps the ILO has taken to act against child labour, and the global challenges faced when trying to eliminate child labour. The Report also set out a Global Action Plan to eliminate child labour for 2006-2010 (see below).

2010 Global Action Plan (2006)

The Action Plan set out time-bound targets for the elimination of child labour and gives IPEC’s strategic direction for its operations at the country, regional and global levels and outlines key actions to be taken to 2010.


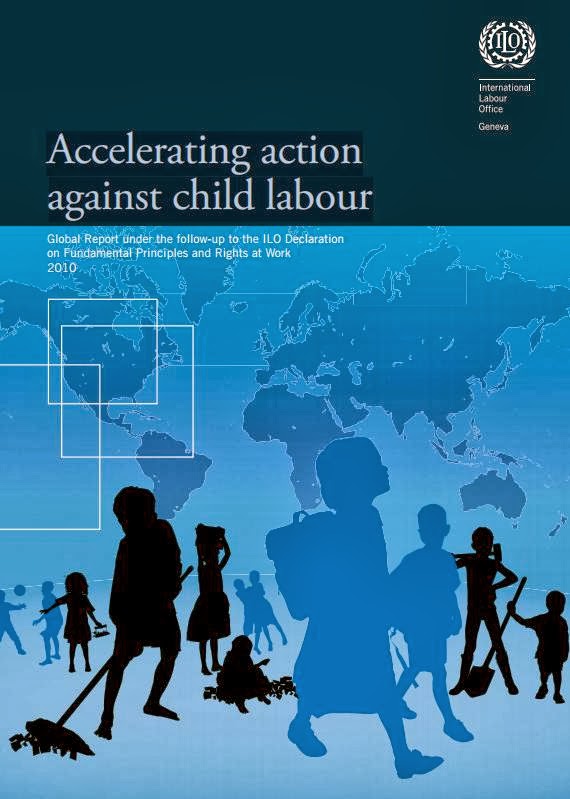
Third Global Report "Accelerating Action Against Child Labour" (2010)

The focus of this Report on child labour is about honouring the commitments made in 2006 with the adoption of a Global Action Plan. The report shows that the pace of reduction in child labour has continued, but it has slowed down to a worrying extent. The report warns that unless decisive action is taken, the 2016 target will not be met. The report contrasts with the positive trends of the previous study done in 2006, which then led the ILO to set the goal of eliminating the worst forms of child labour by 2016.


The 2nd Global Conference on Child Labour, the Hague (2010)  
"Towards a world without child labour - Mapping the road to 2016"

The year 2010 is 10 years after the coming into force of ILO Convention 182 on the Worst Forms of Child Labour (WFCL), the most widely-ratified international labour convention, and it is 6 years ahead of the global target of eliminating the WFCL. 

The conference objectives were:
  • to achieve rapidly universal ratification of ILO Conventions Nos. 138 and 182
  • to deliver the commitment to take immediate and effective measures to end the worst forms of child labour as a matter of urgency; and
  • to agree on significantly intensified efforts to reach the 2016 goal laid down in the Global Action Plan.

Roadmap for action to eliminate the Worst Forms of Child labour by 2016 (2010)

At the Hague Global Child Labour Conference on 10-11 May 2010, more than 450 delegates from 80 countries agreed on a Roadmap aimed at “substantially increasing” global efforts to eliminate the worst forms of child labour by 2016. The Roadmap calls on governments, social partners and civil society organizations to strengthen access to education, social protection and decent work. The Roadmap specifically calls on governments to “assess the impact of relevant policies on the worst forms of child labour, taking into account gender and age, put in place preventive and time-bound measures and make adequate financial resources available to fight the worst forms of child labour, including through international cooperation”.


Policy Note "Tackling child labour: From commitment to action" (2010)

This Policy note has a particular focus on the progress being made by ILO member States in ratification and application of the ILO’s child labour Conventions. It also aims to shed light on how the right to be protected from child labour can benefit from the recognition and enforcement of other fundamental principles and rights at work and public policies which promote social justice.


Marking progress against child labour: Global estimates and trends 2000-2012 (2013)

This report follows the Global Report series on child labour under the follow up to the ILO Declaration on Fundamental Principles and Rights at Work. Its focus is on the presentation of the new fourth round of child labour estimates for 2012 and to identify the trends from 2000 to 2012. The estimates are based on refined estimation techniques fully comparable with the ones for 2000, 2004 and 2008 rounds. 
The new estimates presented in this Report indicate that 168 million children worldwide are in child labour, accounting for almost 11 percent of the child population as a whole. Children in hazardous work that directly endangers their health, safety and moral development make up more than half of all child labourers, numbering 85 million in absolute terms. The largest absolute number of child labourers is found in the Asia and the Pacific region but Sub-Saharan Africa continues to be the region with the highest incidence of child labour with more than one in five children in child labour.
There were almost 78 million fewer child labourers at the end of this period than at the beginning, a reduction of almost one-third. The fall in girls in child labour was particularly pronounced – there was a reduction of 40 percent in the number of girls in child labour as compared to 25 percent for boys. The total number of children in hazardous work, which comprises by far the largest share of those in the worst forms of child labour, declined by over half. Also progress was especially pronounced among younger children, with child labour for this group falling by over one-third between 2000 and 2012.

The 3rd Global Conference on Child Labour, Brasilia (2013)

At The Hague Global Chid Labour Conference (10-11 May 2010), the Government of Brazil announced that, in cooperation with the ILO, Brazil would host the III Global Child Labour Conference in 2013 to measure progress in implementing the The Hague Roadmap and towards the goal of 2016. The Conference is an opportunity for reflection and joint dialogue between government, social partners, civil society, regional and international organisations on the progress made in the process towards the elimination of child labour, especially its worst forms, as well as a space for presenting proposals of mechanisms to accelerate the elimination of this phenomenon. 


- Melinda Deleuze


Friday, 6 September 2013

Sanitation in schools


This blog, written by Wikichild co-ordinator Melinda Deleuze, is a part of the Wikiprogress September spotlight on "Education and skills". Also, in conjunction with the OECD's 2013 World Water Week, the post discusses the need for improved water and sanitation in schools and various organizations' efforts.

It is important to focus on improving school’s sanitation standards, because children are often the most vulnerable to diseases, according to wateraid.org. Children also take new ideas and habits back to their homes and families, increasing programs’ impact. 

Only 49% of schools around the world provide drinking water to its pupils and 11% of schools provide water for handwashing. In Kenya, although 63% of schools provided drinking water, only 27% had treated water. Also, while 63% of schools in Kenya have handwashing water available to its students, only 8% of schools have soap. Studies show that handwashing with soap can reduce the risk of diarrheal disease by more than 42% (Curtis and Caincross, 2003). 

Over the past few years, multiple organizations have been working hard to increase the number of schools with drinking water, sanitation facilities and handwashing stations. According to the Sanitation and Water for All project update (April 2013), in the past year, Nigeria mobilized private sector resources for provision of WASH facilities in over 700 schools.


Sustaining and Scaling School Water, Sanitation and Hygiene Plus Community Impact (SWASH+), also known as "WASH in schools", is a project established to identify, develop, and test innovative approaches to school-based water, sanitation and hygiene in Kenya. Funded by the Bill and Melinda Gates Foundation and the Global Water Challenge, the project has been running since 2006 with the help of CARE, Emory University’s Center for Global Safe Water, the Government of Kenya, Kenya Water for Health Organisation, Water.org, and SANA. SWASH+ has worked in 185 primary schools in four districts in Nyanza Province, gathering data, learning about challenges and testing solutions for school water, sanitation and hygiene (WASH). SWASH+ provides a base package, which includes:
  1. Provision of water for drinking in safe storage containers
  2. Daily treatment of drinking water with an appropriate technology
  3. Provision of water for handwashing
  4. Daily provision of soap

After the 5-year project, SWASH+ found that:
  • Absenteeism is significantly reduced among girls, with an average of 6 days fewer absences per year.
  • There was a 45% overall reduction of ascaris, and an even greater decrease among girls. Also, the intensity of hookworm infection significantly declined among boys.
  • Unfortunately, there were higher quantities of E. coli bacteria on pupils’ hands who received hygiene, water treatment and sanitation facilities. A study by the European Journal of Tropical Medicine and International Health (2009) found that only 32% of Kenyans wash their hands after fecal contact.
Sapling handwashing, Malawi. Photo: Plan Malawi
Another program working towards increasing drinking water, sanitation facilities and handwashing stations in schools is the Pan African School Led Total Sanitation (SLTS) program. This program is targeting 742 schools in 6 sub-Saharan countries (i.e. Sierra Leone; Ethiopia; Uganda; Kenya; Zambia; Ghana; Niger; Malawi). In each country, the SLTS program follows the same process to facilitate the necessary activities to trigger the schools’ and communities’ progress:
  1. Discuss with the government’s Health and Education sectors, plan at different levels and reach an agreement;
  2. Train teachers who then train students how to use the school latrine and surrounding water and sanitation areas, as well as playing games which help internalize sanitation and hygiene concerns;
  3. Register households for monitoring;
  4. Conduct a school sanitation campaign, cleaning the whole school compound;
  5. Group community into Development Units and establish these groups’ meeting places and times (meetings take place at schools);
  6. Establish a committee of six for each Development Unit who facilitate discussion and prepare a report;
  7. Monitor progress with these reports.
The SLTS program’s 5-year period runs through next year (2014), and this process can be reviewed and changed before the next Pan Africa program begins.

Water and sanitation needs to improve in schools in order to increase school attendance among girls and decrease sickness among all children. Top-down and bottom-up forces are needed to help children become more educated and safer around the world.